Why Better Dashboards Don't Always Create Better Decisions
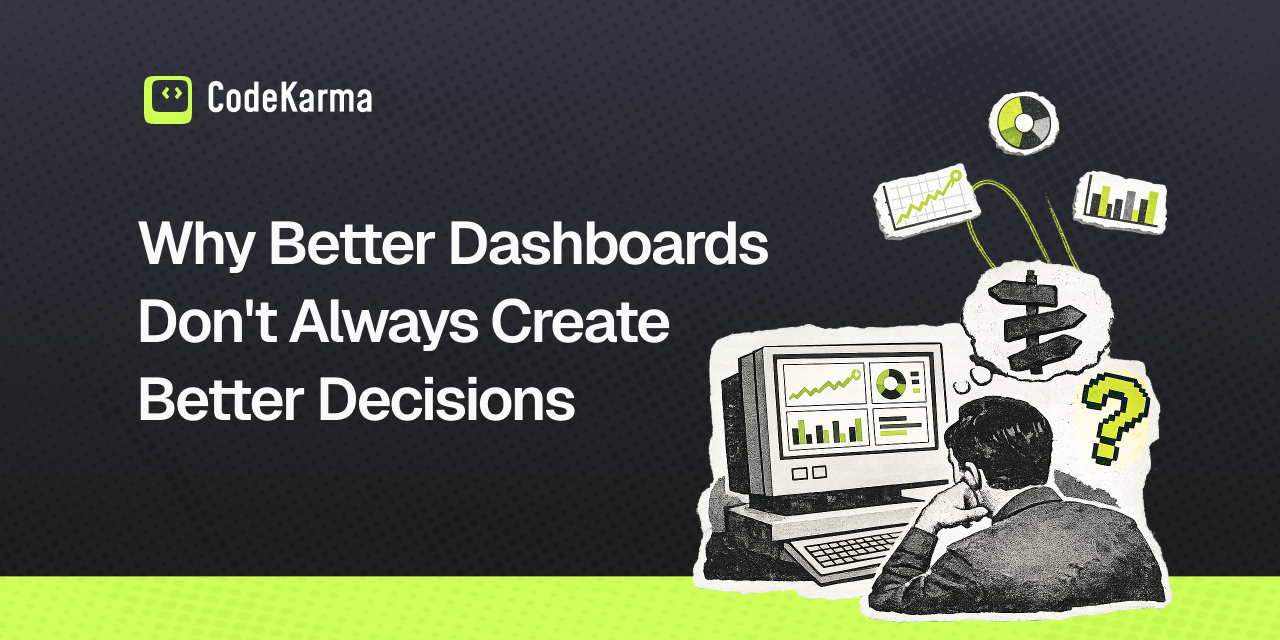
Adding a dashboard rarely settles an argument. It usually starts a new one. Most engineering organisations are not short on dashboards. They have one for latency, one for errors, one for deployments, one for cost, one per team, one per service, and a few that nobody is sure who built. Yet the same questions keep coming back to the same meeting rooms. Is this service healthy. Is that migration safe to start. Is the platform team's investment paying off. Is technical debt getting better or worse.
More dashboards have not made these conversations shorter.
Dashboards centralise data. They do not centralise understanding.
Charts do not align teams. Evidence does.
Walk into a review with three teams looking at the same dashboard. The SRE sees a latency spike. The product engineer sees a deploy. The architect sees a dependency they did not know existed. The leader sees a number that has not turned green for two months. They are looking at the same chart. They are not looking at the same system. This is not a tooling failure. It is a layer failure. A chart shows a measurement. A measurement is a slice of a behaviour. A behaviour is what teams actually need to agree on before deciding anything. Without that shared behavioural picture, every dashboard becomes a Rorschach test. Each team brings its own context, its own assumptions, its own memory of what this service used to do, and reads the same numbers differently. [Image prompt]A minimalist CodeKarma-style dark illustration showing several small grey dashboards floating apart, each with a tiny chart, while one calm neon-lime production behaviour graph sits beneath them, connecting the same nodes with real paths. Use an almost-black background, sparse dotted-grid texture, thin lines, and lots of negative space. No blue/purple gradients, no 3D render, no stock people, and no unnecessary text.
The leadership cost
For engineering leaders, this shows up as decision drag. A modernisation plan needs three meetings before anyone agrees on what the current system actually does. A budget question about a platform investment turns into a debate about whose dashboard is right. A risk review ends with "let's get more data," which usually means "let's build another chart." The bottleneck is not data volume. It is shared interpretation. When leaders, architects, SREs, and developers are working from different mental models of the same system, no number of dashboards will close the gap. Better charts on top of unshared understanding just produce faster disagreement.
The shift
Better decisions do not come from adding another panel. They come from raising the layer everyone is reasoning at. Move the conversation from signals to behaviour. From "what does this metric say" to "what is the system actually doing, across services, APIs, and flows." Once teams share that picture, the dashboards underneath become useful again, because everyone is reading them with the same map in their head. That is the gap KarmaPulse and the broader CodeKarma view try to close — not another chart, but a behaviour-backed view that leaders, platform teams, and developers can all stand on. > Decisions stall when teams have many views. They move when teams share one.